Instant e-commerce analysis - revenue, conv. rate, AOV with Grips browser extension

Grips browser extension

Grips
Sep 2026
All countries
Home/Insights/Retailers/outnorth.de
TRANSACTION INTELLIGENCE - SEP 2026 GLOBALLY

Favicon for outnorth.deoutnorth.de

Start benchmarking for free
Sign in with GoogleSign up with Google
2.2K
Revenue
Sep 26
225.8
Sessions
Sep 26
2.5-3.0%
Conv. rate
Sep 26
$325-350
AOV
Sep 26
Loading...

Bei Outnorth kannst du Produkte der führenden skandinavischen Outdoor-Marken kaufen. Skandinavisches Outdoor hat einen ausgezeichneten Ruf für hohe Qualität und Top-Design.

Loading...

GRIPS CUSTOMERS & RESEARCH PARTNERS

Sally Beauty logoAssembly logoWalmart logoSimpleTire logoNorthwestern University logoColumbia University logo

outnorth.de Annual Revenue and Growth

outnorth.de's annual sales on its online store amounted to $196.2K in 2025, down 50%+ from the previous year. For 2026, revenue is expected to decline by 50%+. The trend is expected to moderate.

Annual Revenue (GMV)2025
$196.2K
Annual growth forecast2025/2026
<0%
Benchmark against your competitors for free
Continue with GoogleSign up with Google
eCommerce Revenue
outnorth.de revenue by year

outnorth.de's monthly revenueOVER TIME
View real-time data

Over the past three months, outnorth.de revenue has experienced growth of 6.5%, compared to the preceding three months.

View real-time data
outnorth.de revenue growth for last six months
Benchmark against your competitors for free
Continue with GoogleSign up with Google
OVERVIEW
outnorth.de operates within the sports category, showing modest performance metrics for September 2026. The site's revenue for online sales reached $2,157, significantly below an average sports store's monthly revenue of around $63,600. With a conversion rate of 2.50-3.00%, outnorth.de sits within the category's typical range of 0.59% to 3.07%. The average order value (AOV) is $325-350, which also falls within the typical range of $79 to $562. The site recorded 226 sessions, far fewer than an average sports store's 25,800 sessions monthly.
Read more

outnorth.de competitors

outnorth.de trails behind sportfits.de in all key metrics, generating a revenue of $2,157 compared to sportfits.de's $1.1 million. In September 2026, outnorth.de recorded 7 transactions and 226 sessions, while sportfits.de outperformed with 6,705 transactions and 459,000 sessions. The average order value (AOV) for outnorth.de is between $325-350, which is significantly higher than sportfits.de's AOV of $150-175. However, outnorth.de's conversion rate of 2.50-3.00% surpasses sportfits.de's 1.00-1.50%. Meanwhile, competitors like naturzeit.com and unterwegs.biz also show considerable strength, with revenues of $405,000 and $692,000, respectively. Overall, outnorth.de stands at 4th out of 6 in terms of revenue and transactions, indicating a need for growth in a competitive landscape.

exxpozed.de screenshot
#1 exxpozed.de
449.8
Revenue
322.8
Sessions
0.5-1.0%
Conv. rate
$225-250
AOV
naturzeit.com screenshot
#2 naturzeit.com
405K
Revenue
125.9K
Sessions
2.0-2.5%
Conv. rate
$150-175
AOV
unterwegs.biz screenshot
#3 unterwegs.biz
691.8K
Revenue
158.5K
Sessions
3.0-3.5%
Conv. rate
$125-150
AOV
outdoorsports24.com screenshot
#4 outdoorsports24.com
45.9
Revenue
10.1
Sessions
2.0-2.5%
Conv. rate
$175-200
AOV
sportfits.de screenshot
#5 sportfits.de
1.1M
Revenue
459.1K
Sessions
1.0-1.5%
Conv. rate
$150-175
AOV
outnorth.de vs top market performers
outnorth.de
top retailers
conversion rate vs average order value for outnorth.de and its competitors
Benchmark against your competitors for free
Continue with GoogleSign up with Google
Review the entire assortment of this retailer and thousands of others in the Grips app
Sign in with GoogleSign up with Google
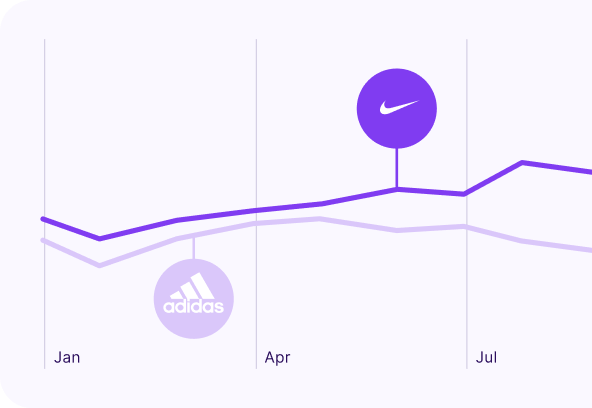
brands overtime comparison

Gain even more insights with the Grips app

outnorth.de channels

Identify top traffic channels that drive growth for outnorth.deand discover how performance of traffic channels has changed over time.

Sign in with GoogleSign up with Google

outnorth.de Google Ads spend

Evaluate outnorth.de's Google search ad spend, ad clicks and cost-per-click. Review performance over time and gain deeper view into their ad campaign spend.

Sign in with GoogleSign up with Google

outnorth.de devices

Review outnorth.de's performance across desktop and mobile devices. Analyze how revenue, conversion rate, transactions, AOV and sessions vary depending on the device shoppers use.

Sign in with GoogleSign up with Google

outnorth.de top markets

Explore outnorth.de's key markets, identifying countries that contribute the highest revenue, transactions, and sessions, along with those with the highest Google search ad spend.

Sign in with GoogleSign up with Google

outnorth.de country & global rank

Assess the ranking of outnorth.de among other retailers within its primary country and worldwide.

Sign in with GoogleSign up with Google
Understand how your competitors drive sales.
Drive growth and optimize key metrics with our e-commerce intelligence platform
Grips Platform Dashboard